Basketball
Shot Economy: More and Better
Series 02 / 03What We Heard From Sean Sweeney. What Orlando's Numbers Can Show.
- Published
- September 9, 2026
- Evidence period
- 2025–26 regular season
Give me the quote
“…getting more shots, getting better shots than our opponent”
Sean Sweeney, introductory press conference, 15:01
In the previous post in this series, we looked at the talent on this Magic roster to see how it stacked up against the league, and to see if it warranted authentic enthusiasm from new head coach Sean Sweeney. TL;DR: the Magic sit somewhere in the middle of the league regarding talent. Their talent is fairly evenly distributed across roster slots 1 through 9, with more of its value on defense. We suspect this would excite a coach with Sweeney’s background.
In this post we’ll be taking a look into the efficiency of last season’s roster according to their shot diet, and set a framework for evaluating if Sweeney has an opportunity to add some protein and cut out some excess carbs, or if the Magic were already sticking to a well-balanced shot diet.
Questions, questions, and more questions
Did the Magic create more scoring opportunities than their opponents last season? Did the shots taken from these opportunities come from high value spots on the court? Which players were taking these shots and how did that affect the outcome?
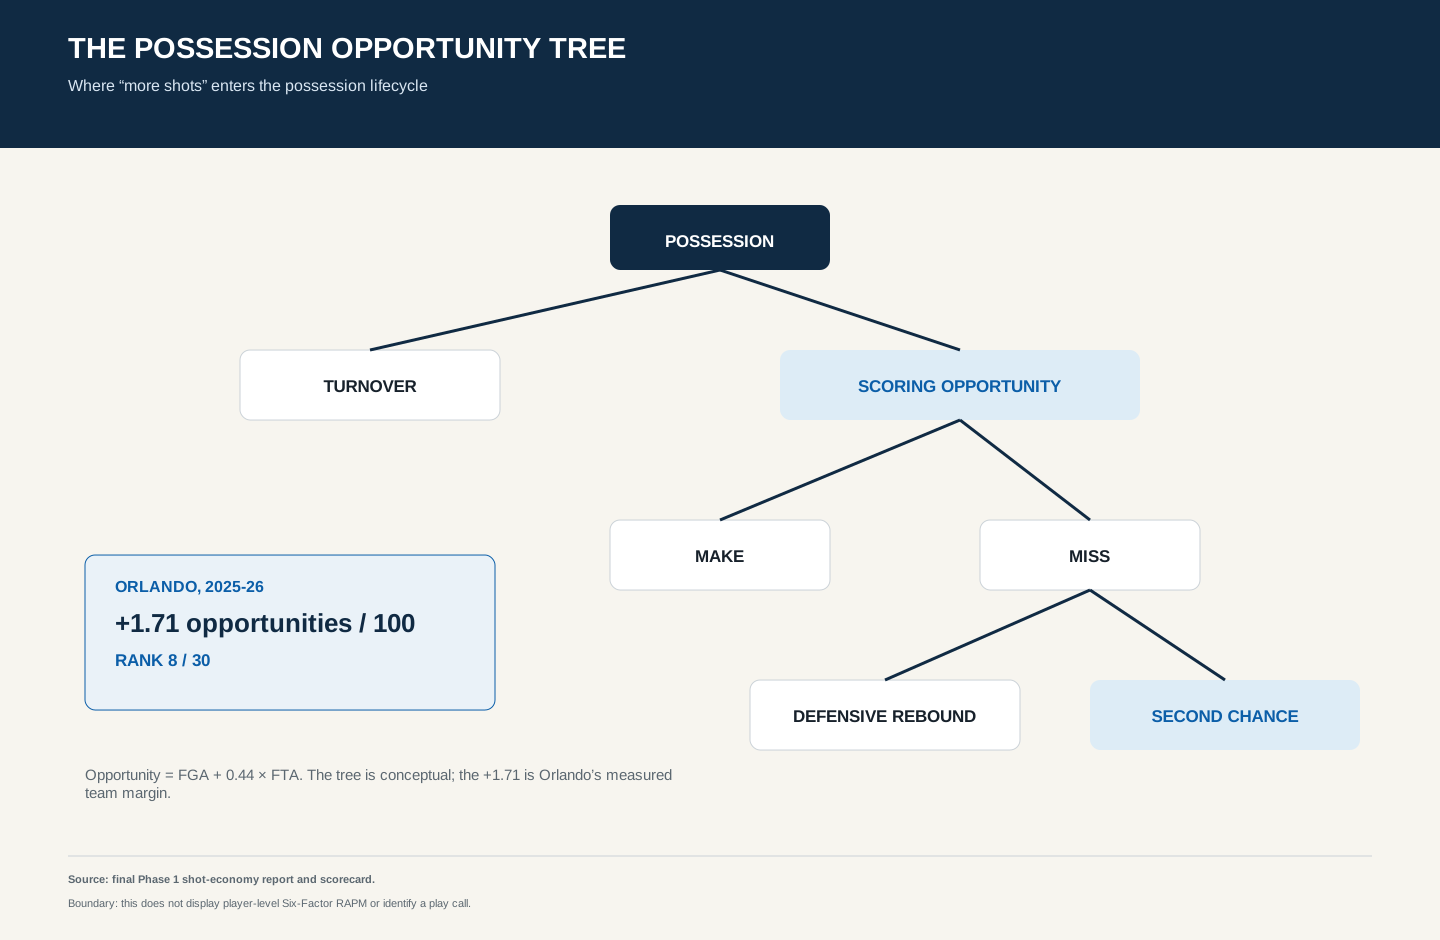
Let’s start with a simple answer to a simple question. Yes, the Magic did generate 1.71 more scoring opportunities per 100 possessions than their opponents. This puts them 8th in the league. Ceteris paribus (ceteris is almost never paribus :( ) this is good news! How did the Magic achieve this?
Agreeing on terms
When we say “scoring opportunity” we have a specific definition and calculation to reference: field-goal attempts (FGA) + 0.44 × free-throw attempts (FTA). Notice we apply a weight of 0.44 to FTA. We do this because one trip to the line can produce one, two or three attempts, and not every free throw represents a new possession. The factor applied approximates trips to the line from individual FTA. The result is expressed as a per-100-possessions figure in order to eliminate differences due to pace.
If you apply the average return value per opportunity, the Magic’s +1.71 edge accounts for +2.00 points per 100 possessions. Should you do this? Check out my prior post about marginal vs average possessions and develop your own intuition.
The figures don’t just tell a pace story. Possession opportunities can be affected by things such as turnovers, offensive rebounds, and fouls. Check out the chart below:
More is good. More of better is better.
In order to quantify “better” we start with location of the shot according to one of five spots: rim, non-rim two, corner three, above the break three, and free throw. We assign each location an expected value using the other 29 teams’ seasonal results. By pulling Orlando out of its own benchmark (leave-one-team-out methodology), we ensure their makes and misses don’t influence the value used to grade them.
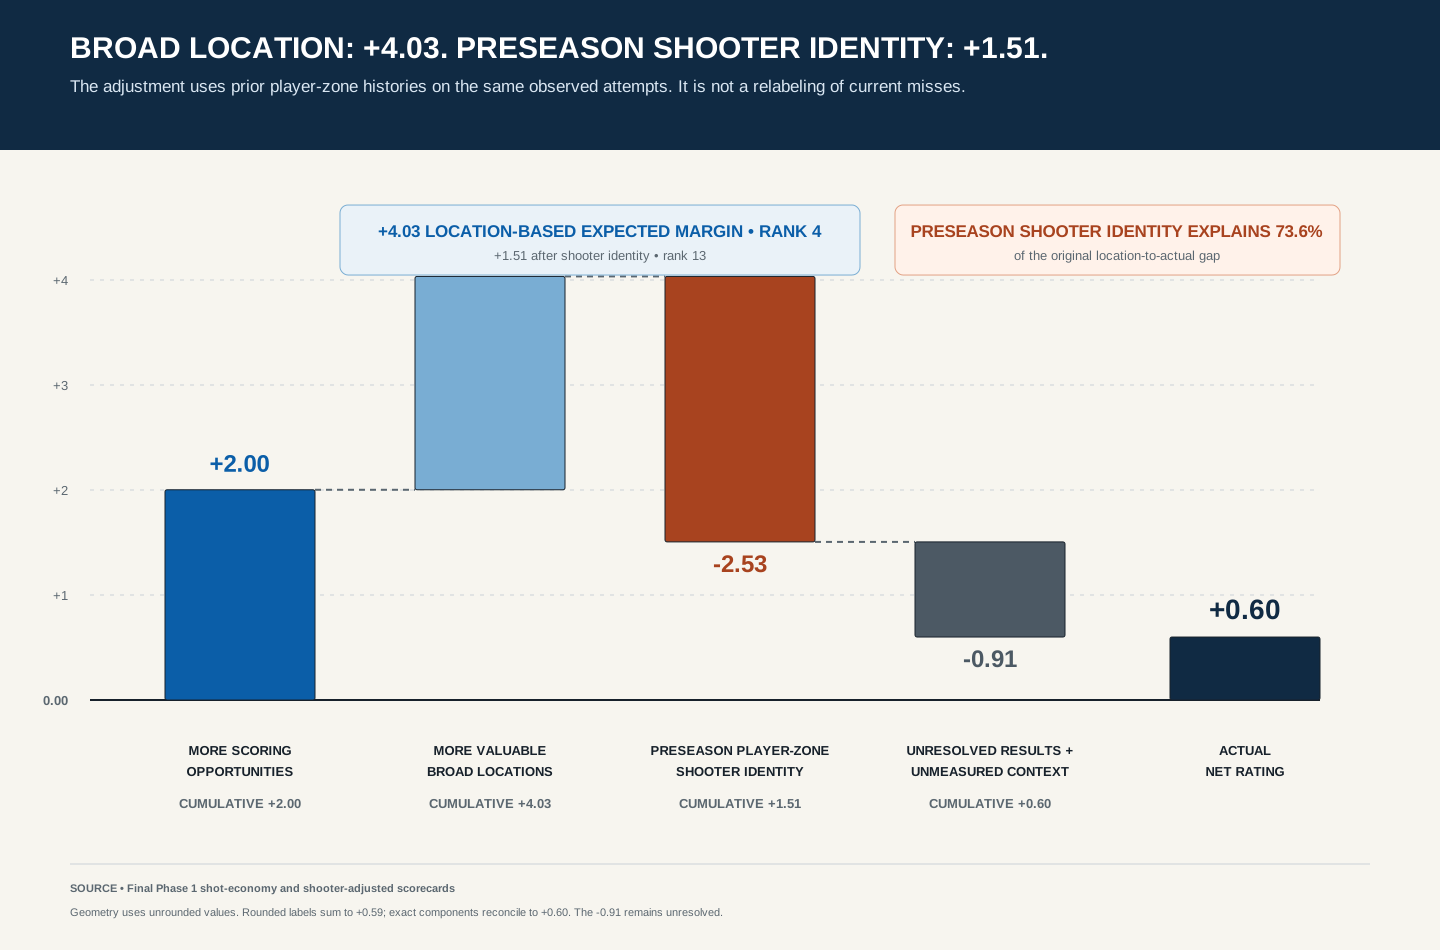
The Magic’s location-value margin comes in at a seemingly-paltry-but-actually-pretty-good +0.02 expected points per scoring opportunity. When put in terms of points per 100 possessions, this adds a +2.03 margin in excess of the opportunity-volume contribution, good enough for fourth out of thirty teams. Adding this to the +2.00 margin from quantity, we’re looking at a +4.03 margin which is also good enough for fourth in the league.
A waterfall chart such as the one below can be helpful to visualize where the component parts of this margin come from. The first two ascending steps in the chart show the results before player-specific history is accounted for. We see the lift from more opportunities and a good mix of shot locations.
We must keep in mind that location value alone is not equal to shot quality. It fails to address things like how open the shooter was, shot-clock pressure, incremental difficulty within a given zone, preceding action leading to the shot, etc.
If the Magic got more and better shots, why weren’t they taking on the Spurs in the Finals?
Looking at the waterfall chart, we see a third reddish bar dumping cold water on our imaginary championship parade. By adding in shooter expectations estimated from prior regular seasons, we start to get a picture of where things come back to earth. Basically, this layer helps us get an idea of what we would expect from a given shooter according to their prior performance.
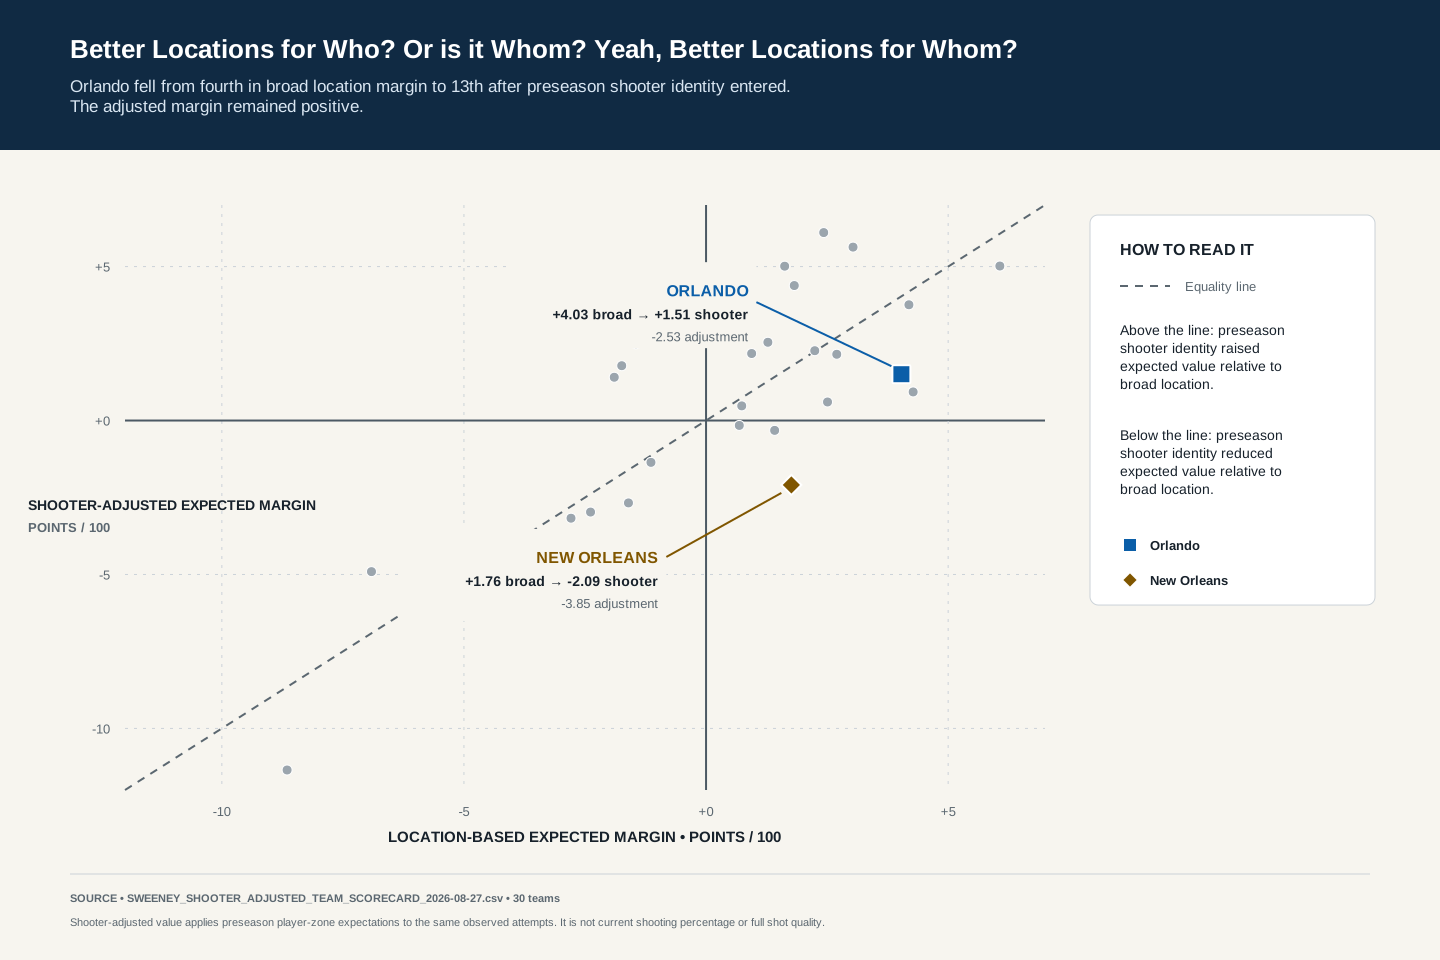
This layer wipes out 2.53 points per 100 of margin, dropping the Magic from +4.03 to +1.51. This puts the Magic back down to 13th out of 30 teams. Shooter identity is able to explain just shy of 3/4 of the original gap between the location-only expectation and the observed +0.60 Net Rating, meaning Orlando outscored opponents by 0.60 points per 100 possessions. We’re left with a dangling residual of -0.91 to satisfy the auditors.
Our model here uses empirical-Bayes shrinkage. In plain language, each player-location estimate combines that player’s earlier regular-season makes and misses with a league baseline for the location. Large histories carry more of the player’s own record. Small histories are pulled more toward the league value, and players with no history receive the fitted location baseline. No 2025-26 makes enter the expectation being tested.
How this relates to other public analytics
NBARAPM Six-Factor RAPM uses regularized adjusted plus-minus (RAPM) to separate shooting efficiency, turnover economy and second chances. This article similarly separates opportunity quantity from opportunity value, but NBARAPM did not produce Orlando’s numbers here.
DataBallr ShotQuality RAPM separates pre-shot quality, shot making and free-throw value with richer contextual information. This article intentionally uses a more transparent and narrower measure: five broad locations plus prior shooter history. DataBallr is not evidence for the displayed Orlando result.
Regarding talent, offense and defense seemed to paint different pictures. Is that the same here?
Much like our prior post on how the marginal possession is not the average possession, the waterfall chart above shows how we can easily draw wrong conclusions from taking a number at face value. It might be tempting to think Orlando’s players had a lower expected value once prior player-zone history was included.
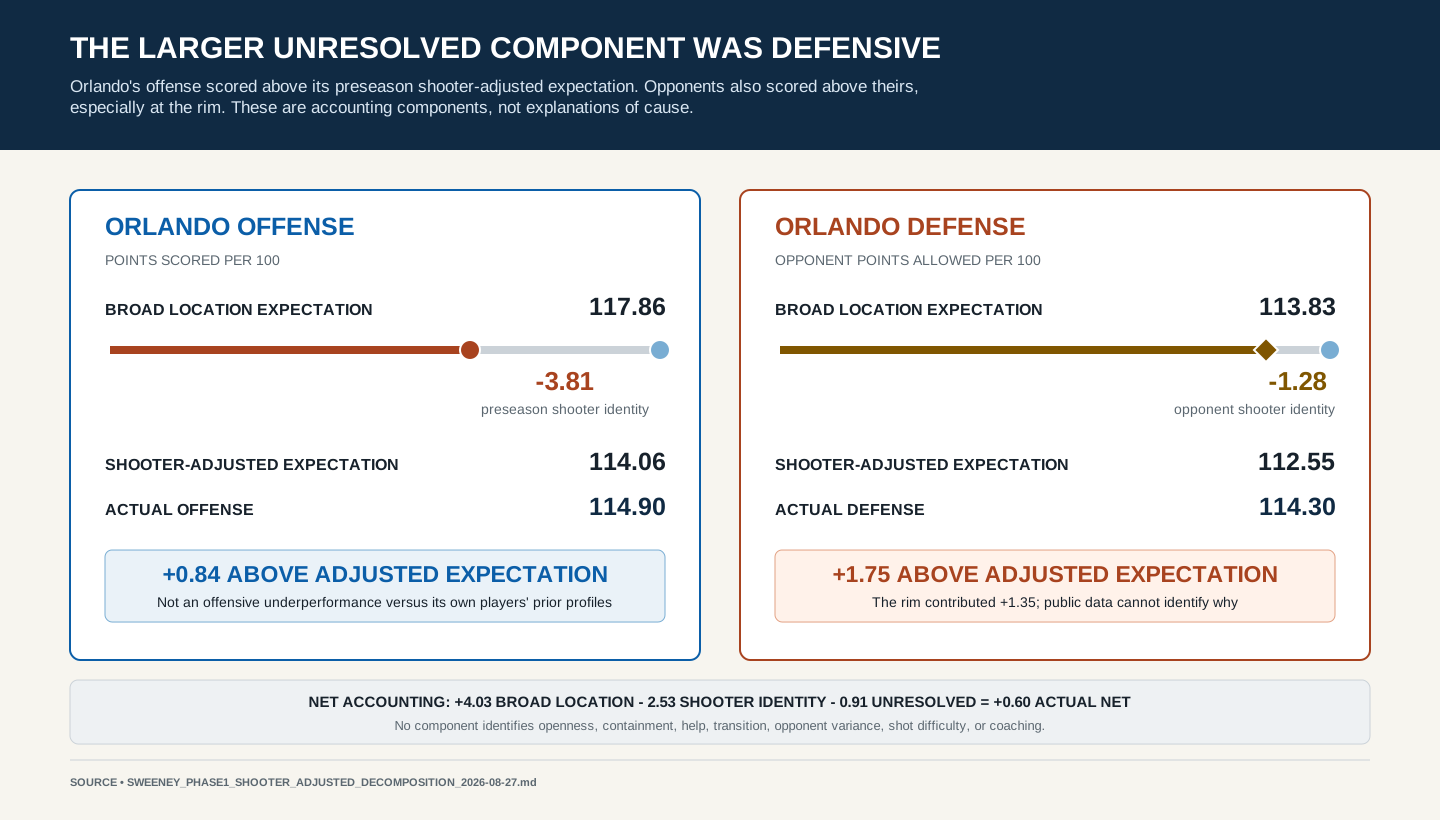
The league-average values applied to the Magic’s five broad locations implied 117.86 points per 100 possessions. Taking prior-regular-season shooter-specific expectations into account reduces that expectation by 3.81 points, to 114.06. Orlando actually scored 114.90 points per 100, or 0.84 points above the shooter-adjusted expectation.
So what do we make of this +0.84 residual? Can we attribute it to Mosley’s offensive savvy? We can’t quite say that. All we can say at this level is that Orlando scored 0.84 points per 100 above the expectation generated by the observed shot distribution and prior-regular-season player-zone histories. The model does not identify why.
The bigger factor worth looking at came from the defense. Opponent identity dropped expected points allowed by 1.28 points per 100, to 112.55. Opponents actually scored 114.30 points per 100. Included in the +1.75 defensive residual is the +1.35 observed at the rim.
Using the data we have, we can identify where that difference is, but we can’t diagnose it. We don’t have access to separations between things like rim protection, point-of-attack containment, help defenders, shooter openness, or shot difficulty.
Give me names. I need names.
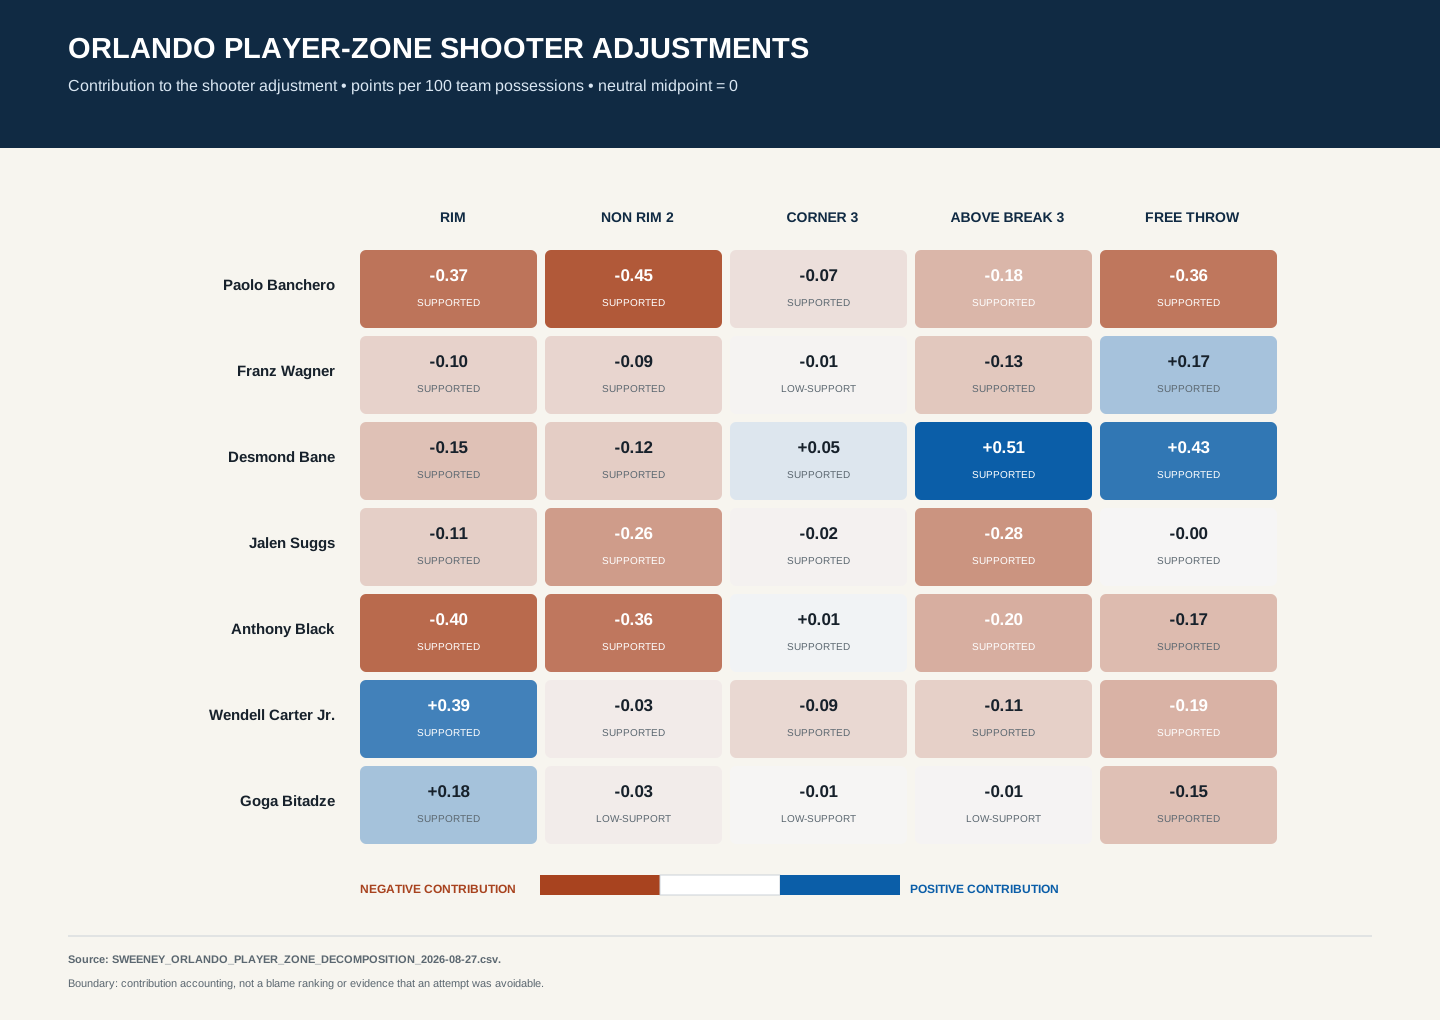
The correction identified in the previous section was spread across multiple players and locations. What we don’t want to do with the heatmap below is take this -3.81 adjustment and convert it to a list of bad shooters. The reddish and bluish cells give us a look at how each player-location profile moved expected points from the league average.
I don’t want to point fingers, but if you do, maybe start with Paolo and his non-rim twos. They represent the biggest individual offensive player-zone contribution at -0.45 points per 100 team possessions. This info alone doesn’t let us know if his low-value attempts were avoidable or if the team had better options. You’ll have to rely on my watching of the games last season to let you know that yes, better decisions could have been made. Some of this is due to dumping the ball off to the guy who can get about any shot off late in the clock, but much was also the result of a stagnant offense with too few actions. This gives me some optimism for the upcoming season in knowing we have a substantial area to improve by cleaning up Paolo’s diet. (You can make the same statement, though literally for Zion Williamson and the Pelicans)
Give me numbers. I need numbers.
So, Sweeney wants more and better shots than the opponent. The team has proven able to produce more scoring opportunities last season with +1.71 per 100 ranking 8th out of 30 teams. Defining “better” shots as those from higher value broad locations on the court, again the Magic proved successful last season by adding +2.03 points per 100 above their opponents.
The area I’ll be looking to see Sweeney improve is the shooter identity adjustment. The Magic’s points per 100 margin was reduced by 2.53 as a result of who was taking the shots.
Limitations
Our analysis above doesn’t show that the Magic missed easy shots. It doesn’t show that the offense did not effectively execute the schemes laid out by the prior coaching staff. It doesn’t show that a different shot allocation strategy is guaranteed to improve net performance. We can’t say for certain the cause of the +1.75 defensive residual or the +1.35 rim component was personnel, scheme, bad luck, or shot difficulty. And finally, none of these figures predict the offense we’ll see under Sweeney in 2026–27.
This baseline does not account for defender distance or shooter openness, so it cannot distinguish a wide-open attempt from a heavily contested one within the same broad location.
What are some things the Magic could test?
Orlando certainly has a shot-quality model (if not, I’d be happy to help them build one!). Does this model also reduce the broad location +4.03 advantage after including shooter identity, shooter openness, and shot clock?
Which player-zone allocations could be changed without taking away from the +1.71 opportunity margin?
Why were opponents converting at the rim +1.35 points per 100 greater than their own prior-regular-season shooter expectations?
Which returning or added players improve shooter-specific opportunity value without giving back Orlando’s defensive and possession advantages?
How can we track this during the season?
The 2025-26 results give us a baseline against which we can compare the results from the Sweeney-led Magic in 2026-27. I’ll track the following from Orlando:
- scoring-opportunity margin per 100 possessions
- points added by opportunity volume
- points added by the five broad locations
- shooter-identity adjustment
I’ll keep the actual Net Rating and remaining residual beside those expectations. I’ll also separate offense and defense so a team-level number does not hide which side is doing the work.
The definitions need to remain consistent. League location values should continue to leave Orlando out of its own benchmark. The 2026-27 shooter expectations should be estimated before the season using earlier regular-season attempts, with no 2026-27 makes entering the expectation being tested. Because early rankings and player-zone results will be noisy, each update should show games played alongside season-to-date and rolling 10-game results.
A tracker can keep the team-level waterfall, the offense-defense split, and the player-zone view in one place. It still will not distinguish a wide-open shot from a heavily contested one unless a validated attempt-level source is added.
The shooter adjustment proves that player identity matters. Sweeney’s next statement adds the defender. What can public matchup data actually show about who covered Orlando’s main players and how they responded?
Methods and sources
The observed attempts, free throws, possessions and actual ratings are 2025-26 REGULAR-SEASON RESULTS. Scoring opportunities equal FGA + 0.44 × FTA; using 0.40 instead did not materially change Orlando’s ranking. The five broad locations are rim, non-rim two, corner three, above-break three and free throw. Seasonal league location values leave the team being evaluated out of the average.
Shooter expectations are estimated separately for each player and location using regular-season attempts before 2025-26. A Beta-Binomial empirical-Bayes method pulls small histories toward the fitted league location baseline and allows larger histories to carry more player-specific information. Players without prior attempts receive that baseline. No current-season makes enter these expectations.
The decomposition applies broad location values and prior-season shooter expectations to the same observed attempts, then compares both with actual scoring. The remaining residual contains current-season conversion, within-zone difficulty, openness, shot clock, defensive and play context, measurement error and other unobserved factors; it is not assigned a cause.
No preseason-game results and no 2026-27 outcomes were used. Sources are the final Phase 1 shot-economy report, final shooter-adjusted decomposition, approved team and player-zone scorecards, NBA V3 regular-season event data and Basketball Reference possession and rating inputs. Only approved derived aggregates are shown.
Sweeney’s quotation comes from the Orlando Magic’s official coverage of his introductory press conference, the only approved introductory source used for this series.