Basketball
How Much Offense Can Orlando's Defense Create?
Series 03 / 03What We Heard From Sean Sweeney. What Orlando's Numbers Can Show.
- Published
- October 10, 2026
- Evidence period
- 2024–25 and 2025–26 regular seasons
Give me the quote
“The better we play on offense, the better we defend. The better we defend, the better we play on offense.”
Sean Sweeney, introductory press conference, 15:08
No advanced stats are needed to tell us that Orlando’s offense needs to show a leap this season if a postseason run is the goal.
While this roster has proven capable of performing at a high level on defense, the inefficiency on offense is what we’re anxious to see improve. When Sweeney references the complementary nature of the two ends of the court, understanding just how defending better will lead to more points draws our immediate interest. Anyone who suffered through Orlando’s half-court sets over the past couple of seasons would undoubtedly prefer watching forced misses and turnovers lead to fast breaks and attacks on defenses yet to get set.
Just how much offense are the advantages provided by effective defense worth over the course of a season? In order to see real improvement, will Orlando only need to maximize these transition opportunities, or will they need to lean more heavily on improvements in half-court sets?
What is a favorable possession start worth?
PBPStats provides us with possession labels that tell us how the other team’s prior possession ended. I combined those labels into five possession start categories: after a live-ball turnover, after a live miss, after a made field goal, after a made free throw, and after a dead ball or timeout.
The sample consists of 243,762 classified possessions in 2024–25 and 245,196 in 2025–26.
After a live-ball turnover, the next offense scored 1.323 points per possession in 2024–25 and 1.338 in 2025–26. After a made field goal, the next offense scored 1.119 and 1.131. The advantage was just over 0.2 points in each season.
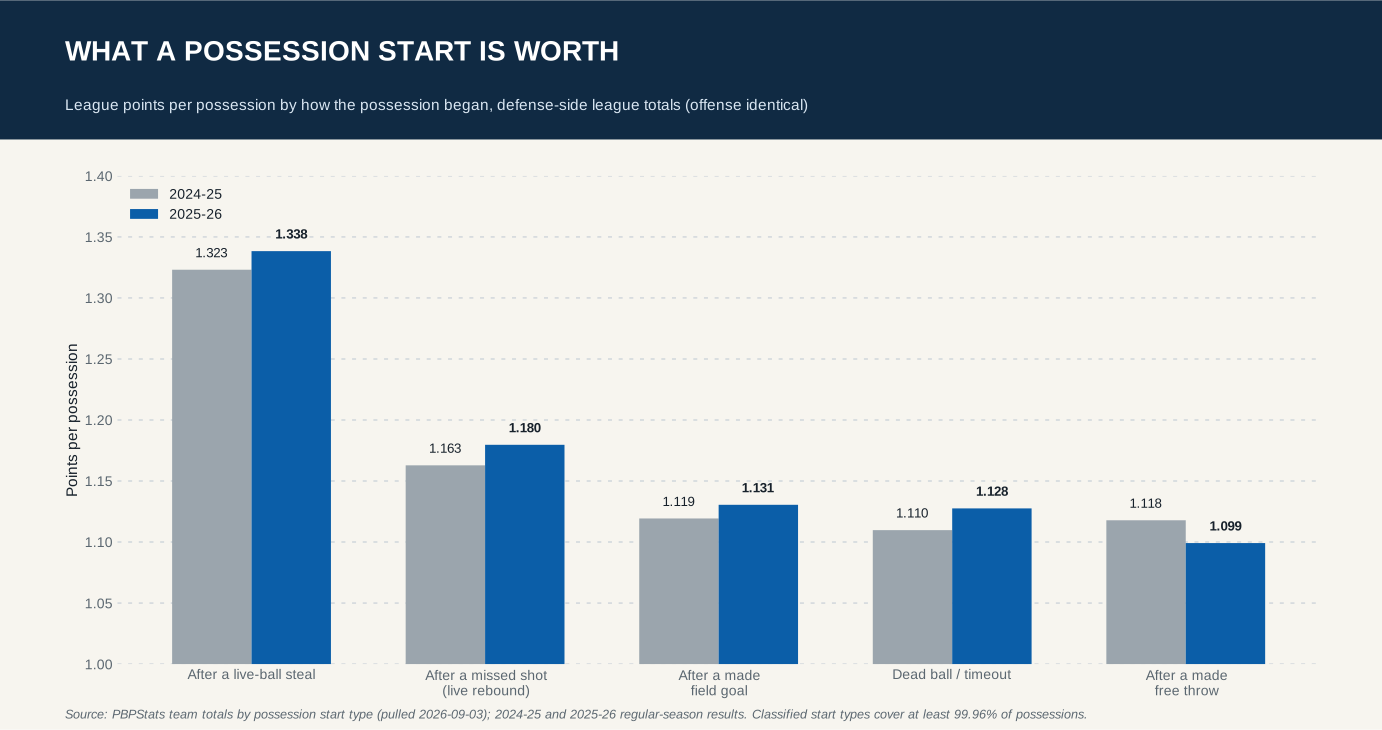
There is a clear benefit to the expected value of a possession that starts from a steal or defensive rebound.
Calculating the advantage at a season level uses a smaller scale. If a team is able to move possession starts from made FGs to live-ball turnovers by one percentage point, the return is only ~0.20 points per 100 possessions. A pretty big sustainable change in possession start mix is required to gain even a single point.
How much offense can the defense create over a season?
In order to distinguish possession-start opportunity from the scoring that followed, I split the rating difference from league average for each team into mix and remainder.
For mix, I assigned the league average scoring value to each start type while giving each team their actual share of start types. This measures the value of the possession created by the defense and the opponent’s outcomes.
The remainder includes everything not captured by mix, such as personnel, shooting, opponent quality, scheme, and noise.
Offensive mix ranged from -0.27 points per 100 possessions for the Pacers to +0.38 for the Pistons in 2025-26. Mix had a standard deviation of 0.16 points, compared with 3.27 points for ORTG and 3.20 for remainder.
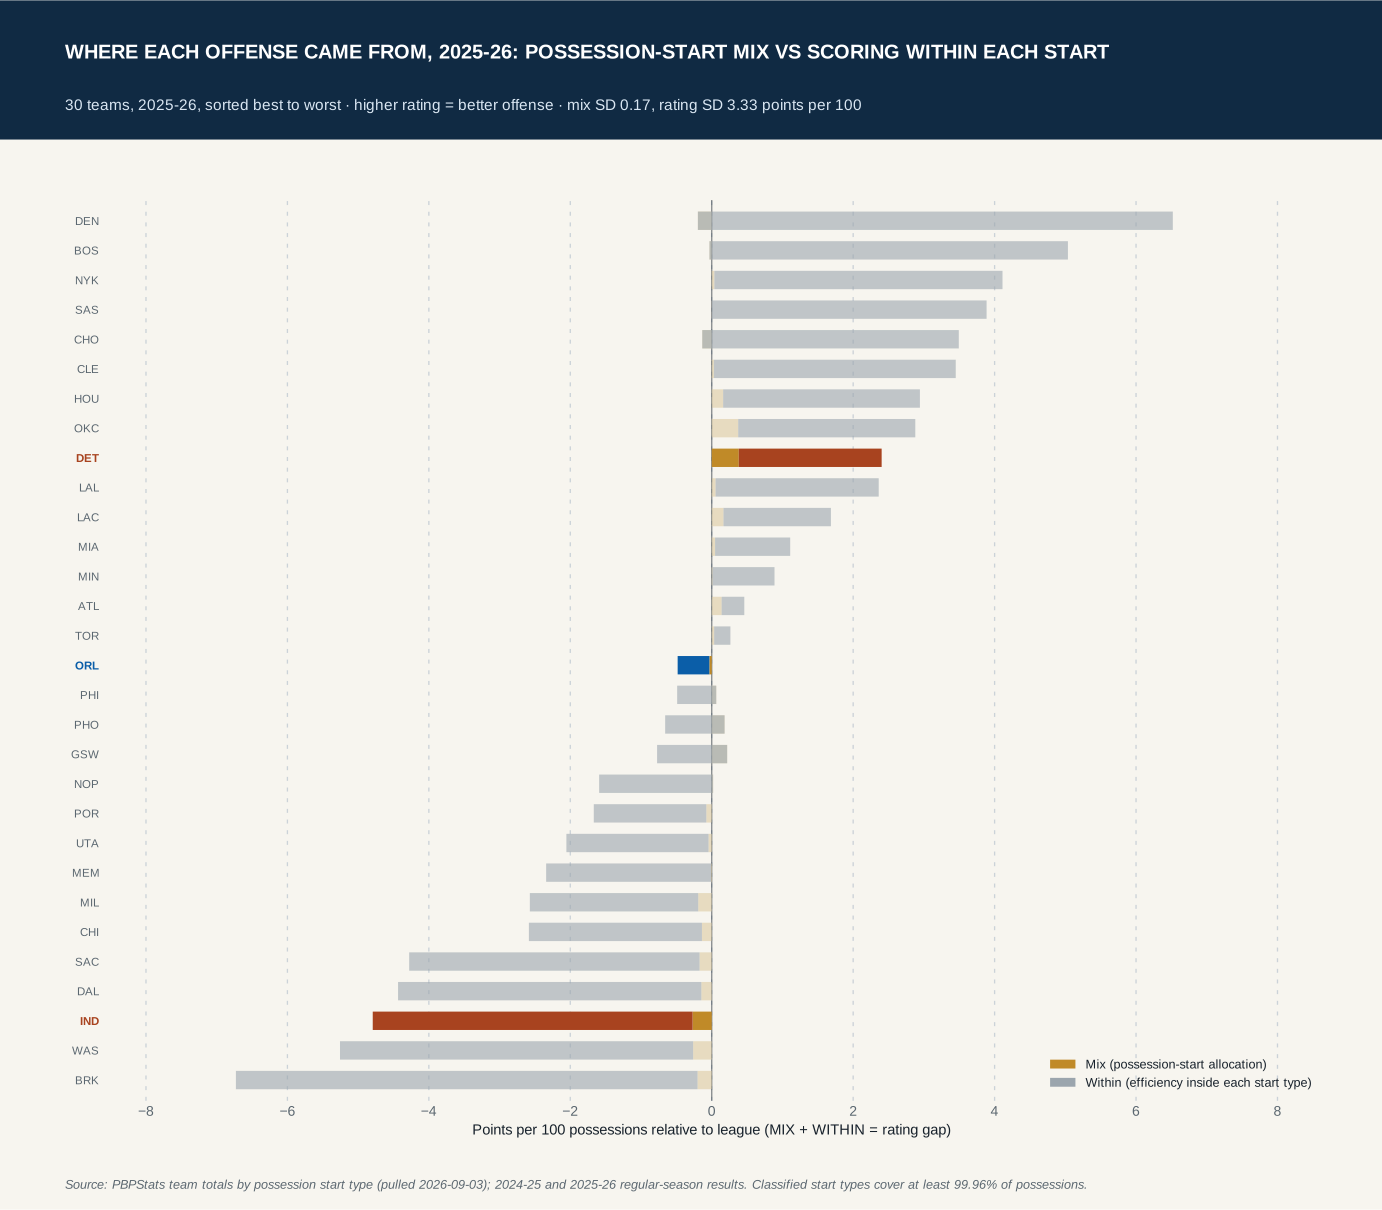
As you might expect, teams with better offenses tended to have a more favorable mix of possession starts. Mix and ORTG had a correlation of 0.33 in 2024-25 and 0.47 in 2025-26. In either season, the gap between the most and least favorable start mix was pretty small. Less than a single point per 100 possessions separated the best and worst teams. The differences between good and bad offenses are much larger.
While defense can make things easier on the offense, it doesn’t appear that it can overcome deficiencies in the half court.
Orlando Proved Our Conclusion
In 2024–25 the Magic had one of the best possession start mix distributions in the league and still couldn’t score.
The Magic’s mix added 0.14 points per 100 possessions relative to league average. This was good enough for the fifth best mix in the league. Their derived offensive rating was 4.72 points below league average, which ranked 27th. Their remainder was 4.86 points below average and also ranked 27th.
In 2025-26, the Magic had a mix contribution of -0.03 which ranked 19th. Their remainder result improved to -0.45 and ranked 16th. Relative to league average, the offense clawed back 4.24 points per 100 possessions, even while the value of their possession start mix dropped by 0.17.
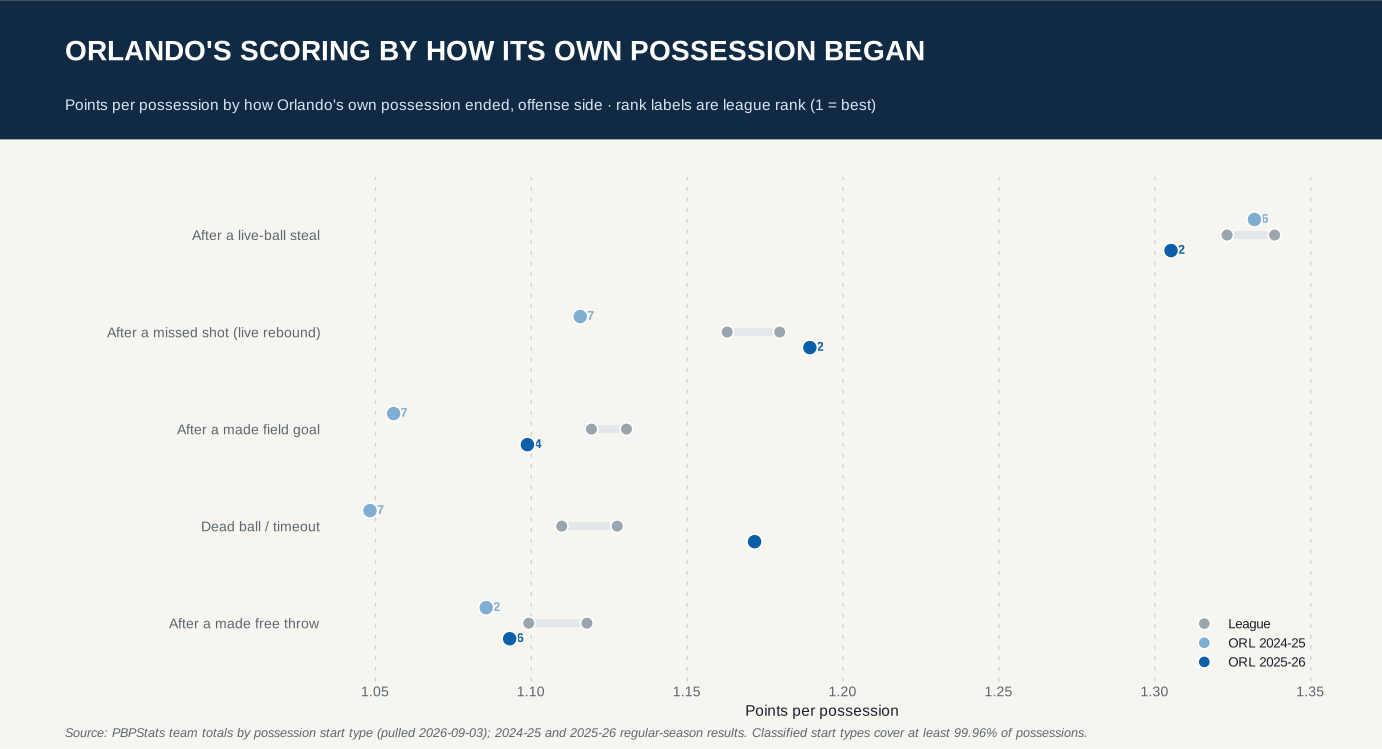
Looking more closely, we can see the improvement came from ordinary possessions. Orlando climbed from 27th to 12th after live missed shots and from 27th to fifth after dead balls or timeouts. They scored 1.33 points per possession after live-ball turnovers in 2024-25 which dropped to 1.31 the following season.
What to watch in 2026–27
I will track three numbers across the season:
-
the share of Orlando possessions beginning after an opponent’s live-ball turnover
-
Orlando’s scoring after made-field-goal and dead-ball starts, when the defense is more likely to be organized
-
points allowed after an Orlando made field goal
The first measures whether the defense is creating more favorable offensive chances. The second tests whether Orlando can score without that help. The third shows whether better offense is coinciding with better defense on the next trip.
Those checkpoints will test Sweeney’s complementary-game mechanism.